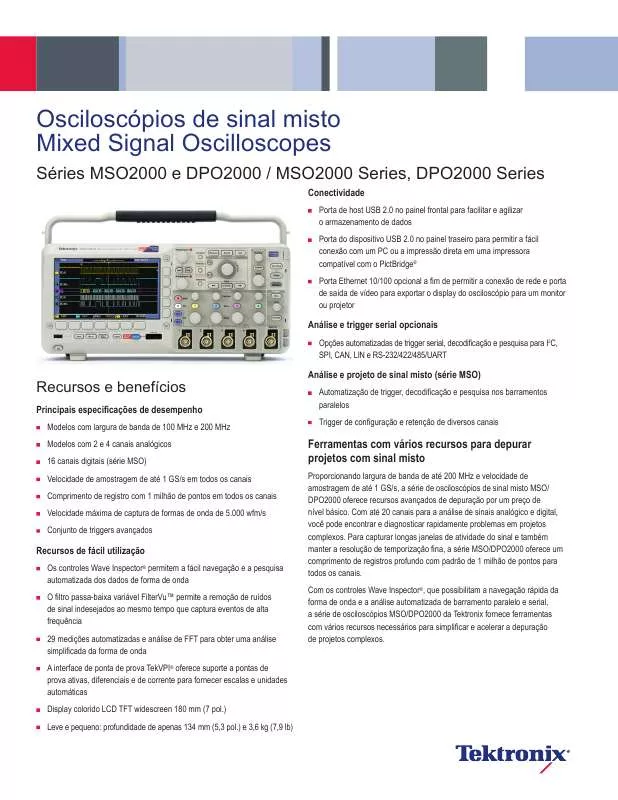
Instruções detalhadas para o uso estão no Guia do Usuário.
[. . . ] Astarefaspodemvariardesimplesverificaçõesdetemposdesubida ecomprimentosdepulsoatéaanálisesofisticadadeperdadepotência eainvestigaçãodefontesderuído. AsérieMSO/DPO2000ofereceumconjuntoabrangentedeferramentasde análiseintegradas, incluindocursoresbaseadosemtelaeemformadeondas, 29mediçõesautomatizadaseanálisedeFFT. Tambémestádisponível osuporteaaplicaçõesespecializadasparaanálisedebarramentoserial. Paraumaanálisemaisampla, aediçãoTektronikdoLabVIEWSignalExpressTM, pelaNationalInstrument, fornecemaisde200funçõesintegradas, incluindo análisededomíniodetempoefrequência, testedelimites, registrodedados erelatóriospersonalizáveis.
www. tektronix. com
3
DataSheet
OscontrolesdoWaveInspectorfornecemumaeficiênciainigualávelnavisualização, nanavegação enaanálisededadosdeformadeonda. Percorraoregistrode1milhãodepontosgirandoocontrole externodedeslocamento(1). Vádoinícioaofimemsegundos. Observoualgointeressanteedeseja obtermaisdetalhes?Gireocontroleinternodozoom(2).
Etapa1dapesquisa:Definaoquegostariadeprocurar.
Navegação e pesquisa do Wave Inspector®
Umcomprimentoderegistrocom1milhãodepontosrepresentamilhares detelasdeinformações. AsérieMSO/DPO2000permiteencontraroevento emsegundoscomoWaveInspector, amelhorferramentadosetorpara navegaçãoepesquisa. OWaveInspectorofereceestescontrolesinovadores:
Zoom/deslocamento
Umcontrolededicadofrontaldedoisníveisforneceumcontroleintuitivo dozoomedodeslocamento. Ocontroleinternoajustaofatordezoom(ou escaladezoom). Girá-lonosentidohorárioativaozoomeexecutafatoresde zoomcadavezmaiores, enquantogirá-lonosentidoanti-horáriofazcomque osfatoresdezoomdiminuame, porfim, sejamdesativados. Vocênãoprecisa maisnavegaratravésdeváriosmenusparaajustaravisualizaçãodezoom. [. . . ] From 2 to 512 waveforms included in average. Scrolls waveforms right to left across the screen at sweep speeds slower than or equal to 40 ms/div.
NI LabVIEW SignalExpressTM Tektronix Edition
Waveform Measurements
Measurement Description
Cursors Automatic Measurements
Waveform and Screen. 29, of which up to four can be displayed on-screen at any one time. Measurements include: Period, Frequency, Delay, Rise Time, Fall Time, Positive Duty Cycle, Negative Duty Cycle, Positive Pulse Width, Negative Pulse Width, Burst Width, Phase, Positive Overshoot, Negative Overshoot, Peak to Peak, Amplitude, High, Low, Max, Min, Mean, Cycle Mean, RMS, Cycle RMS, Positive Pulse Count, Negative Pulse Count, Rising Edge Count, Falling Edge Count, Area and Cycle Area. Isolate the specic occurrence within an acquisition to take measurements on, using either the screen, or waveform cursors. OpenChoice® Desktop
A fully interactive measurement software environment optimized for the MSO/DPO2000 Series, enables you to instantly acquire, generate, analyze, compare, import, and save measurement data and signals using an intuitive drag-and-drop user interface that does not require any programming. Standard MSO/DPO2000 Series support for acquiring, controlling, viewing, and exporting your live signal data is permanently available through the software. The full version (SIGEXPTE) adds additional signal processing, advanced analysis, mixed signal, sweeping, limit testing, and user-dened step capabilities and is available for a 30-day trial period standard with each instrument. Enables fast and easy communication between a Windows PC and the MSO/DPO2000 Series. Transfer and save settings, waveforms, measurements, and screen images. Included Word and Excel toolbars automate the transfer of acquisition data and screen images from the oscilloscope into Word and Excel for quick reporting or further analysis. Provides a standard instrument programming interface for common applications such as LabVIEW, LabWindows/CVI, Microsoft . NET, and MATLAB. Enables control of the MSO/DPO2000 Series over a network connection through a standard web browser. Simply enter the IP address or network name of the oscilloscope and a web page will be served to the browser.
Gating
IVI Driver
Waveform Math
Characteristic Description
eScope Add, subtract, and multiply waveforms. Set FFT Vertical Scale to Linear RMS or dBV RMS, and FFT Window to Rectangular, Hamming, Hanning, or Blackman-Harris.
Arithmetic FFT
12
www. tektronix. com
MixedSignalOscilloscopes--MSO2000Series, DPO2000Series
Display Characteristics
Characteristic Description
Physical Characteristics
Dimensions
mm
in.
Display Type Display Resolution Waveform Styles Graticules Format Maximum Waveform Capture Rate
7 in. (180 mm) liquid crystal TFT color display. 480 horizontal × 234 vertical pixels (WQVGA). Vectors, Dots (In Video Trigger mode), Variable Persistence, Innite Persistence. Up to 5, 000 wfm/s.
Height Width Depth
Weight
180 377 134 3. 6 6. 2
kg
7. 1 14. 9 5. 3 7. 9 13. 7
lb.
Net Shipping Rackmount Conguration Cooling Clearance
4U 2 in. (50 mm) required on left side and rear of instrument
Input/Output Ports
Port Description
Environmental
Characteristic Description
USB 2. 0 High-speed Host Port USB 2. 0 High-speed Device Port LAN Port Video Out Port Auxiliary Input Probe Compensator Output Kensington Style Lock
Supports USB mass storage devices and keyboards. Rear-panel connector allows for communication/control of oscilloscope through USBTMC or GPIB with a TEK-USB-488, and direct printing to all PictBridge-compatible printers. RJ-45 connector, supports 10/100Base-T (requires DPO2CONN). [. . . ] Calibration Data Report 3 years (with Opt. Calibration Data Report 5 years (with Opt. Repair Service 5 years (including warranty).
*4 Requires TekVPI external power adapter (119-7465-00); one per oscilloscope. *6 Probes terminate into 50 but oscilloscope will automatically adjust to account for 1 M input. [. . . ]


